Admin Management
Members of the admins group have access to the Admin page, which
provides user and group management, invitation handling, and server
scheduling for the entire Klangk instance.
Users
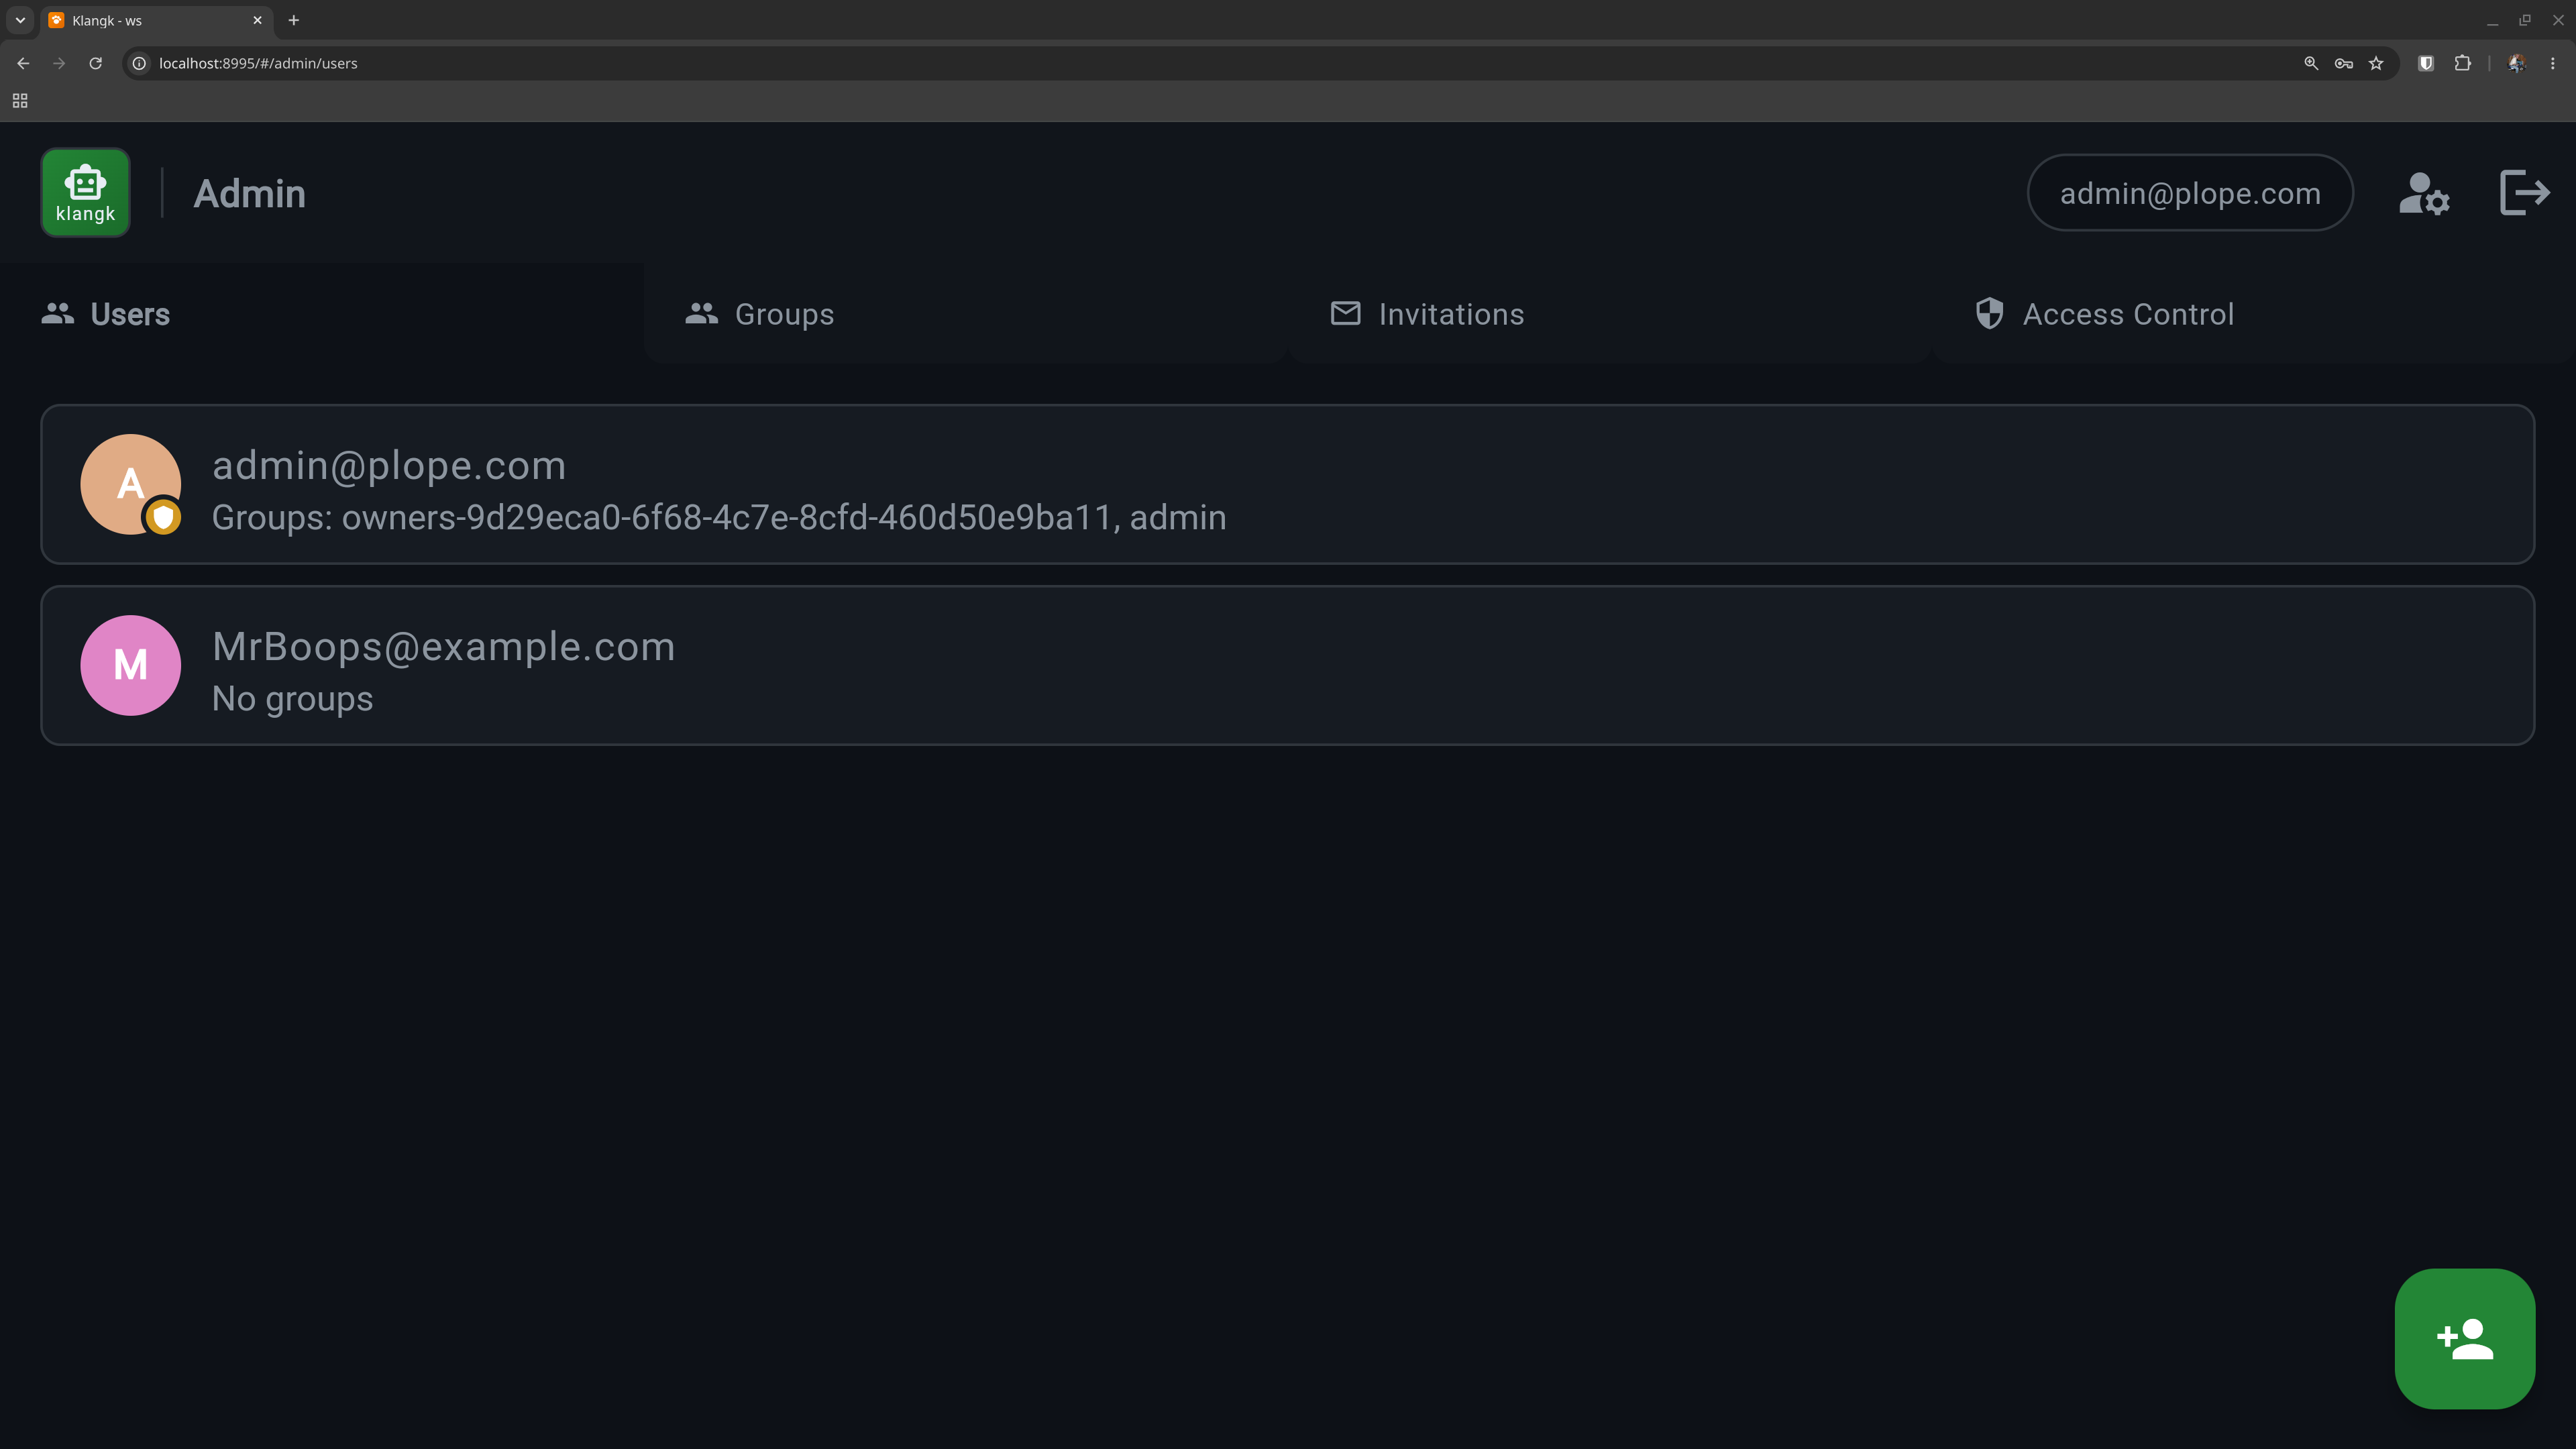
The Users tab lists all registered accounts. From here you can:
- Create users — add a new user with an email and password. Admin-created users are verified immediately (no email confirmation needed).
- Edit users — change a user's email, password, or handle.
- Delete users — remove a user and all their data. Each workspace
is archived to a
.tar.gz(the export/import format, re-importable viaklangk import) before its data directory is removed. You cannot delete your own account.
Groups
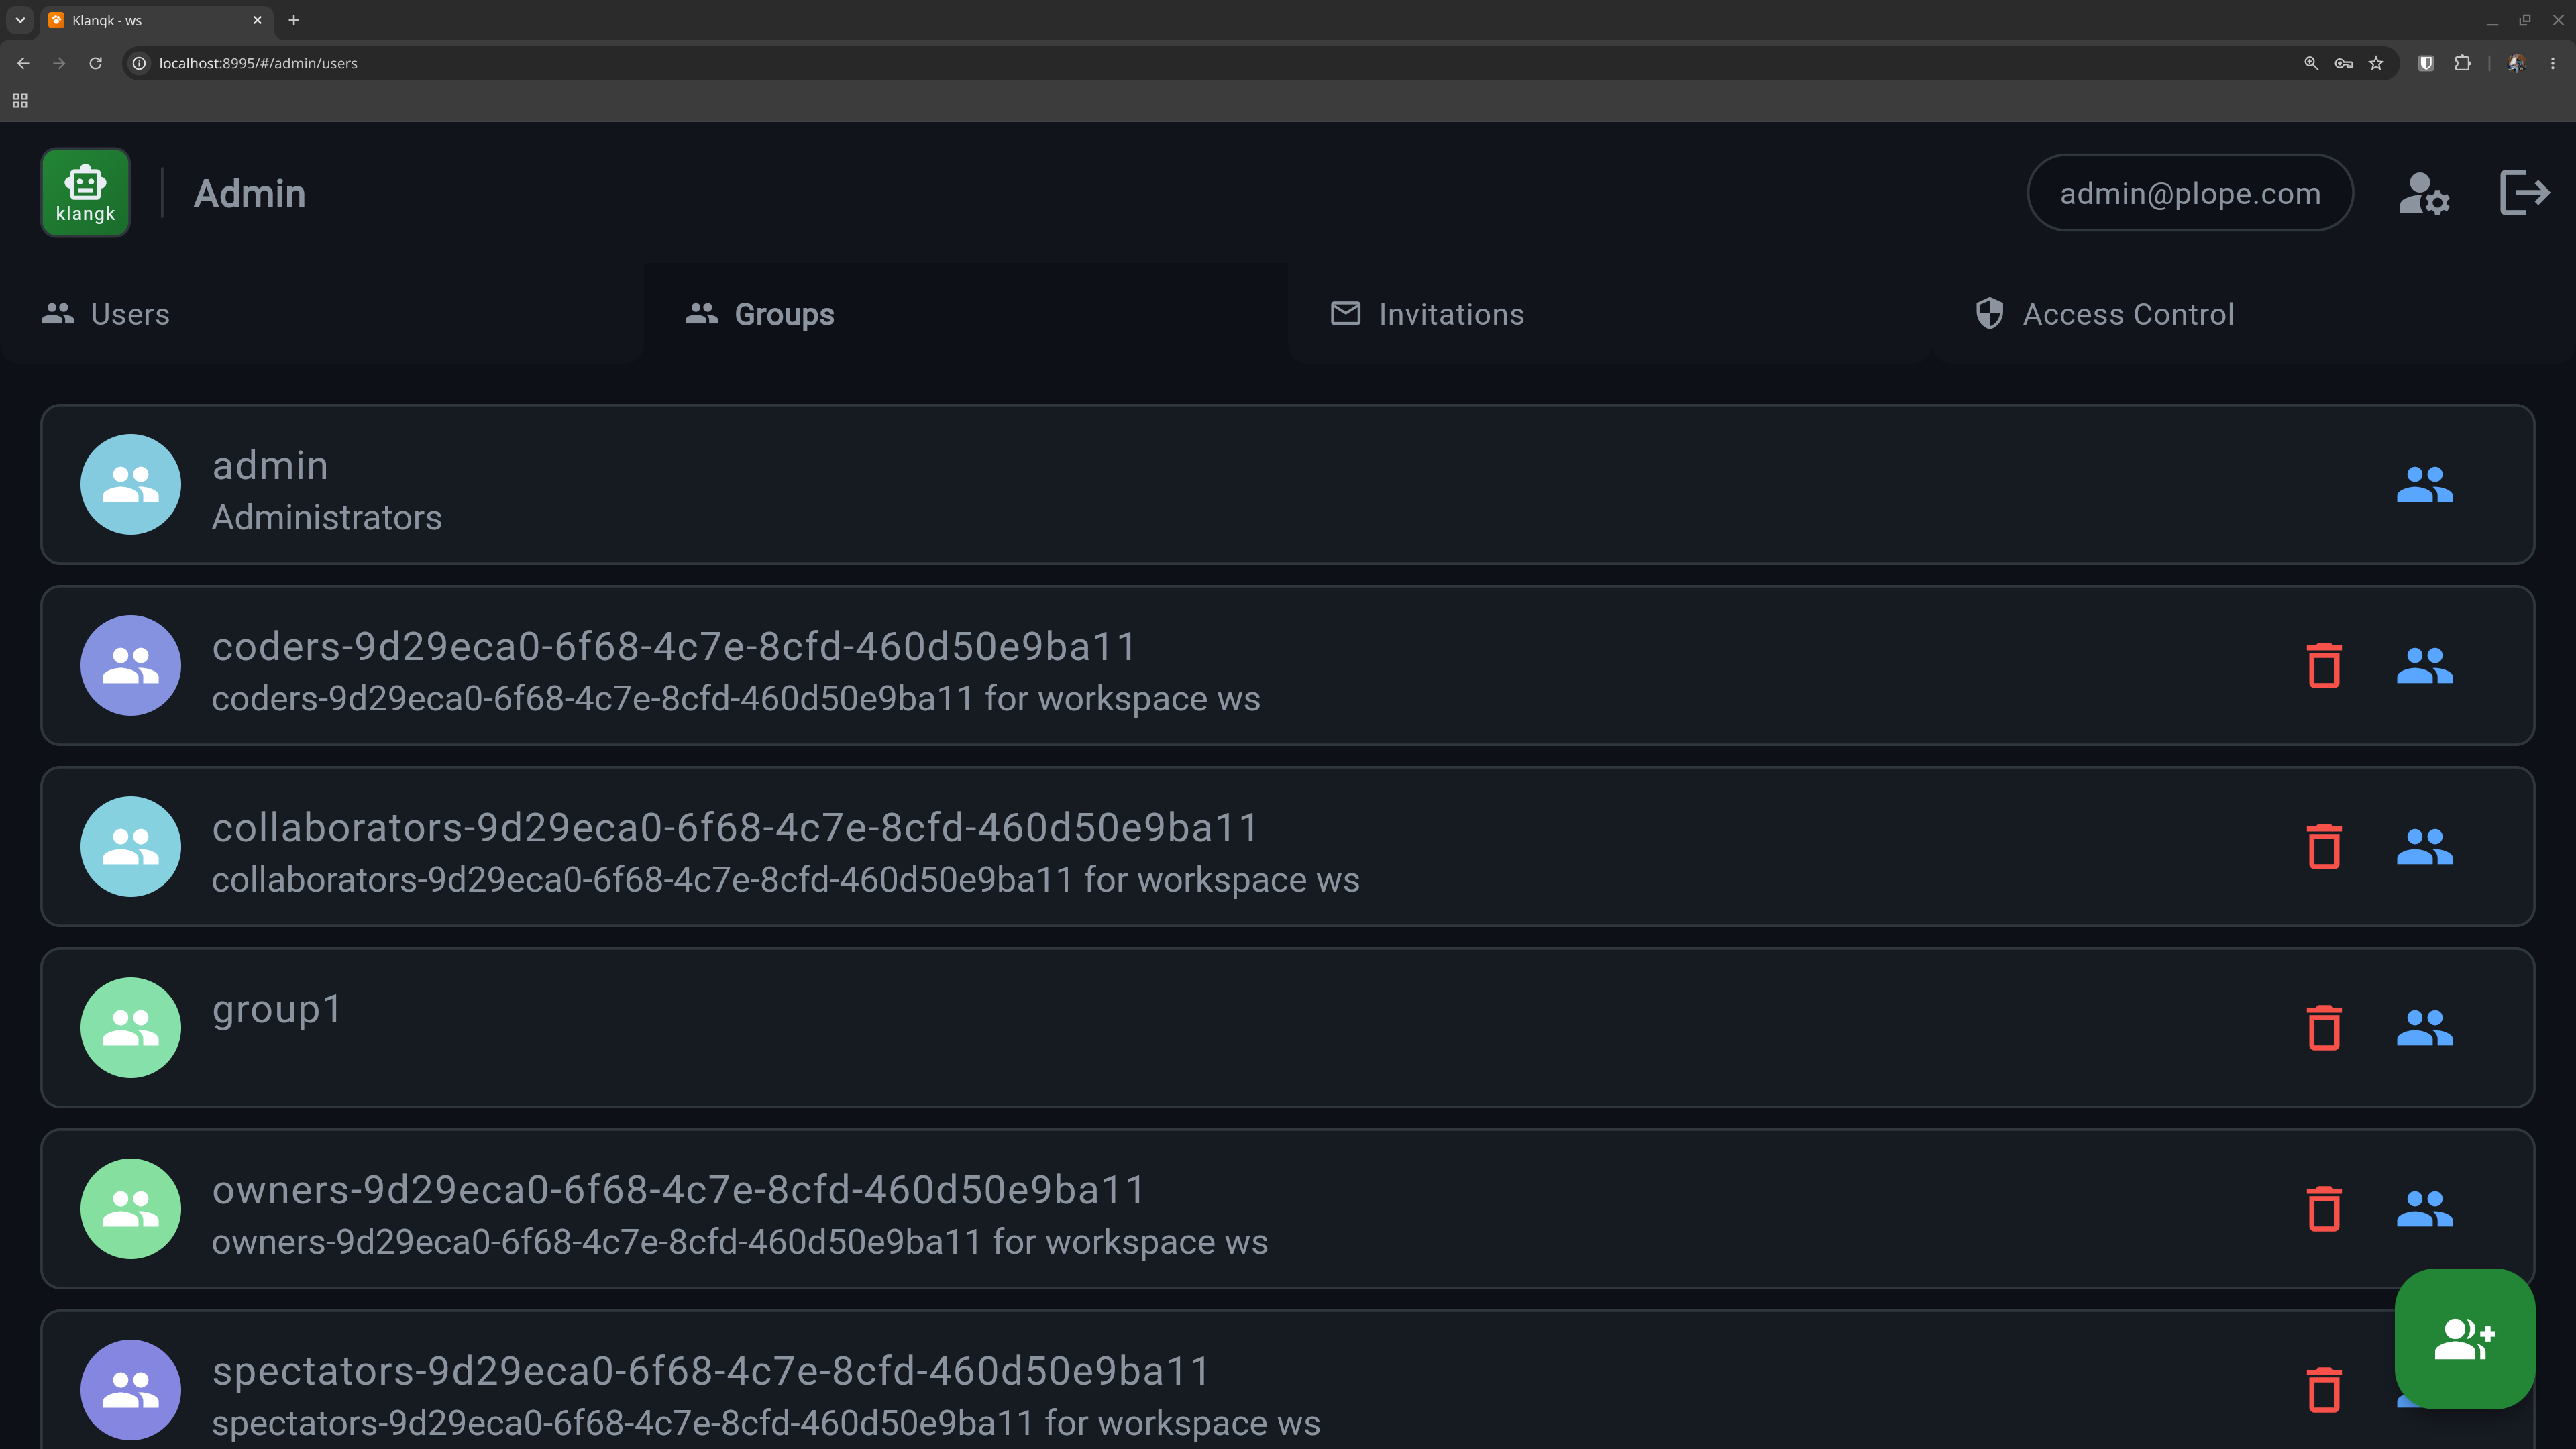
The Groups tab lets you organize users into named groups — create groups, manage members, and delete groups (which also removes any ACL entries referencing them). See Authorization — Groups for the built-in groups and how groups interact with the ACL system.
Server
The Server tab schedules planned maintenance for the klangkd process
(see Server Scheduling for what stop and
recycle actually do):
- Schedule an action — pick Stop or Recycle and either an
absolute time (date and time pickers, your local time) or a delay
(
2h,90m,45s,2h 30m; a bare number means minutes). The form shows when the action will fire. - Pending list — schedules soonest-first with the same live countdown every connected client sees; the list follows the live server snapshot, so changes made elsewhere appear immediately.
- Cancel a schedule — each row has a cancel button with a confirm step; cancelling clears the countdown clients see.
Notifications
Klangk can notify designated recipients (a System Administrator and Information System Security Officer — SA/ISSO — in STIG terms) when security-relevant events happen, in real time rather than only in the audit log:
- Account lifecycle — a user is created (by an admin, by self-registration, by invitation, or automatically on a first SSO login), updated, deleted, unlocked, disabled, or re-enabled. Disables triggered automatically by the inactivity sweep notify too, as one message per sweep.
- Credential and identity changes — password, email, and handle changes, including self-service ones, and group membership changes.
- Audit failures — a failed audit-trail write alerts immediately; an unwritable audit table must not fail silently.
- Capacity refusals — a workspace start refused because host memory cannot fit the workspace's memory limit.
- Disk capacity (#3206) — the resource watchdog checks the
filesystems holding the data directory (where the audit records
live), the state directory, the podman container-storage root, and
any configured extra
paths every minute. Usage crossing the warn threshold (75% by
default) or the critical threshold (90%) sends
resource.disk.warn/resource.disk.critical; falling back below the recovery floor sendsresource.disk.recovered. Events fire on transitions — hysteresis bands below both thresholds hold usage hovering at a boundary at its current state — and a filesystem that stays degraded refreshes its alert once per 5 minutes, so a slowly filling disk produces one alert per episode per filesystem, not one per check, and no alert is permanently lost to the throttle. SeeKLANGKD_DISK_WATCHDOG_*(Environment Variables). - Host memory (#3309) — the same loop watches the memory
utilization of the machine containers run on:
MemAvailablefrom/proc/meminfoon a Linux host (pressed by the cgroup limit when klangkd itself runs memory-capped), and on macOS the podman machine VM's own meminfo read viapodman machine ssh— containers live in that VM, so the Mac host's numbers are the wrong machine. Crossing the thresholds (80% / 90% by default, the critical default aligned with the eviction loop's availability floor) sendsresource.memory.warn/resource.memory.critical/resource.memory.recoveredwith the same transition, hysteresis, and refresh semantics as disk. - CPU pressure (#3309) — PSI
some avg60from/proc/pressure/cpu(inside the podman machine VM on macOS): the share of time at least one task was stalled on CPU over the last minute. Becauseavg60is already a 60-second average, a single-poll threshold crossing (30% / 60% by default) is sustained pressure, not a scheduler spike; a kernel or VM without PSI turns the check off with one logged warning. Eventsresource.cpu.warn/resource.cpu.critical/resource.cpu.recovered. SeeKLANGKD_MEMORY_WATCHDOG_*andKLANGKD_CPU_WATCHDOG_*(Environment Variables).
Two delivery channels are available, and both can be on at once:
- Email —
KLANGKD_ADMIN_NOTIFICATION_EMAILSholds a comma-separated recipient list. Messages go out through the same SMTP or sendmail transport as the verification and invitation emails (Email settings). - Webhook —
KLANGKD_ADMIN_NOTIFICATION_WEBHOOK_URLreceives one JSON POST per notification with the event name, timestamp, actor, target, detail, and source IP. Delivery is one attempt with a short timeout; there are no retries.
With neither channel configured, notifications are off — this is the
default. KLANGKD_ADMIN_NOTIFY_EVENTS narrows the allowlist of event
types that notify (the default is all of them); an unknown event name
in that list aborts startup so a typo cannot silently disable a
notification. A config-file admin_notify_events: [] turns event
notifications off while leaving the channels configured — the
deliberate off switch (blanking the environment variable instead
restores the default allowlist). Persistent conditions (audit.failure,
resource.low, and the resource.disk.* / resource.memory.* /
resource.cpu.* transitions) notify at most
once every 5 minutes — audit.failure once per source table
(audit_events and container_events alert independently), the disk
events once per filesystem, and the memory/CPU events once per metric —
so a degraded audit table or a full
host produces one alert per condition rather than a flood.
The resource watchdog (#3206) adds a second detection layer over the
audit-failure write sites: it watches the audit-write-failure counters
themselves, and a check that observed new failures since the last one
sends one audit.failure summary naming the table and the count. The
summary shares the per-table 5-minute throttle with the write-time
events, so a sustained storm produces one alert per window from either
layer, never both. Fail-closed audit refusals (KLANGKD_AUDIT_FAIL_CLOSED)
pass the same counters, so a start or stop refused because its audit
row could not be written is detected as well.
The watchdog's state is also visible without any channel configured:
GET /health reports status: "degraded" while any metric sits at
warn/critical or the audit pipeline is failing, with a per-metric
detail block naming the degraded condition (#3308) — see
API Endpoints.
Notification delivery is best-effort: a failed email or webhook call is logged as a warning and never fails or delays the action that triggered it.